UNLV Men’s Basketball Statistics
UNLV Player Shooting
Through Nov. 3, 2026 · CBB Analytics
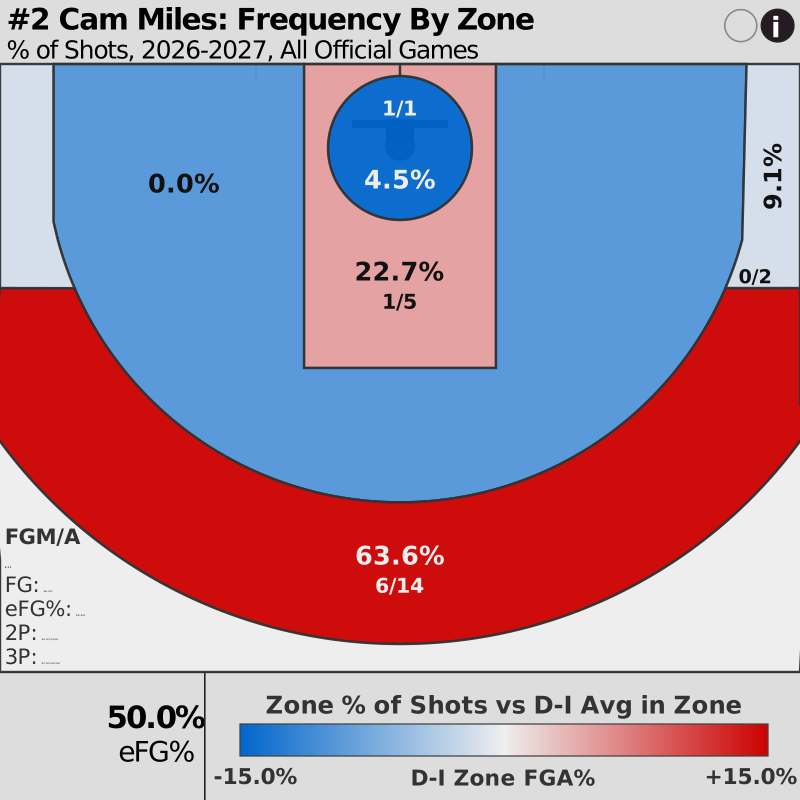
Cam Miles
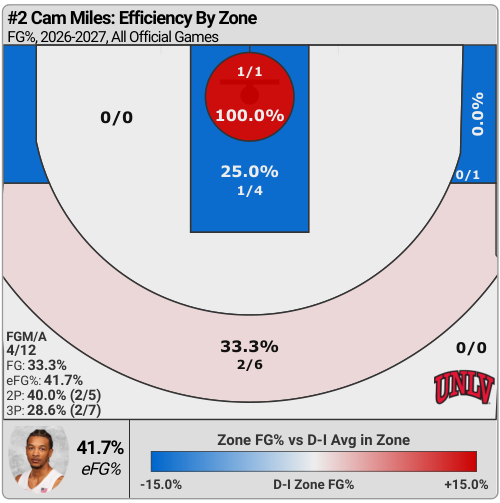

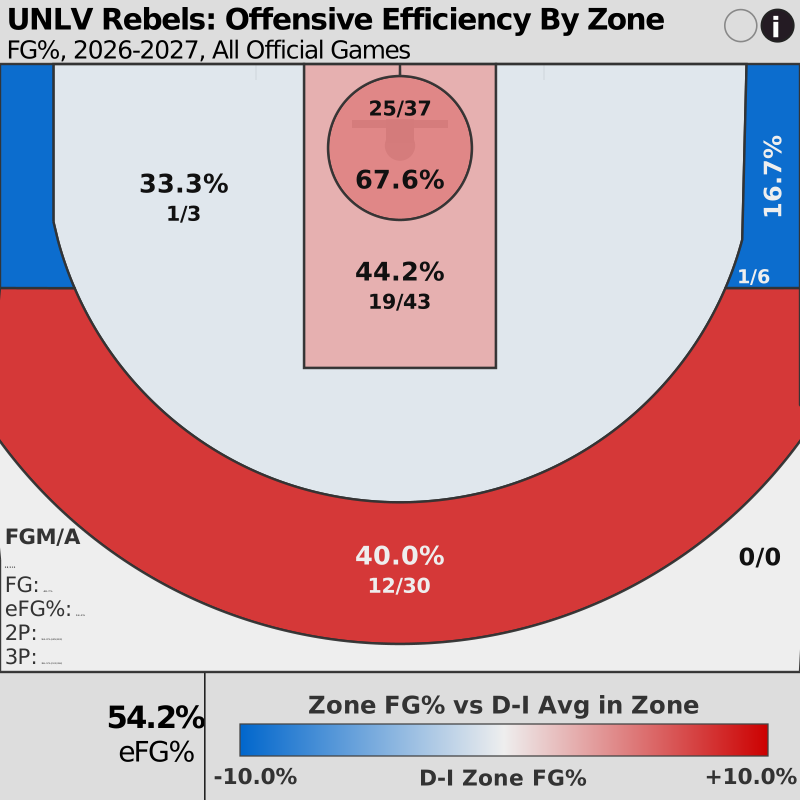
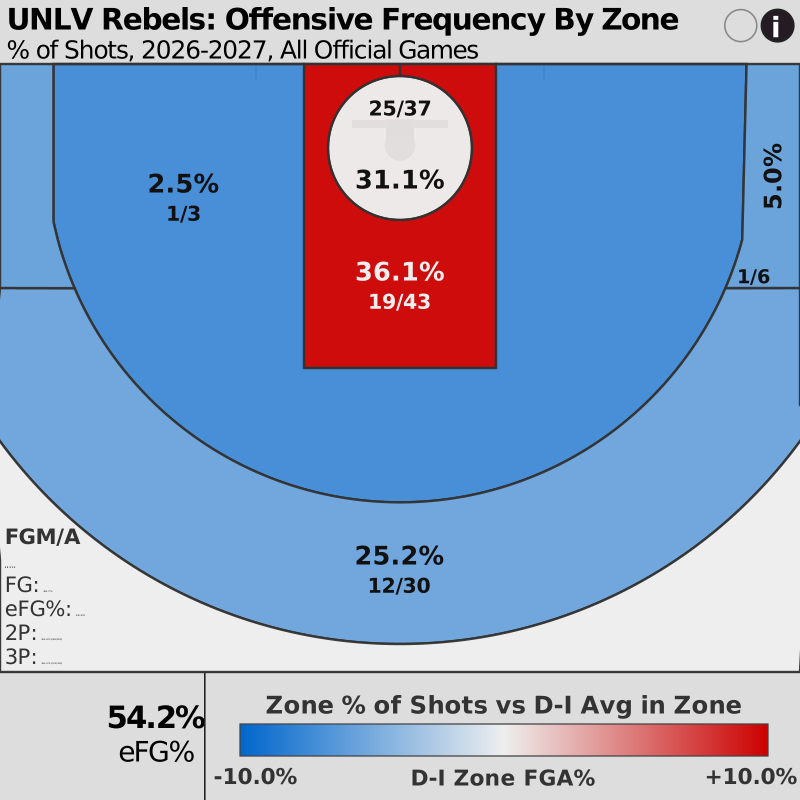
| Shot Zone | FGM–FGA | FG% | Share of Attempts |
|---|---|---|---|
| At the Rim | 1–1 | 100.0% | 8.3% |
| Other Paint Shots | 1–4 | 25.0% | 33.3% |
| Midrange | 0–0 | — | 0.0% |
| Above-the-Break 3s | 2–6 | 33.3% | 50.0% |
| Corner 3s | 0–1 | 0.0% | 8.3% |
Sebastian Mack
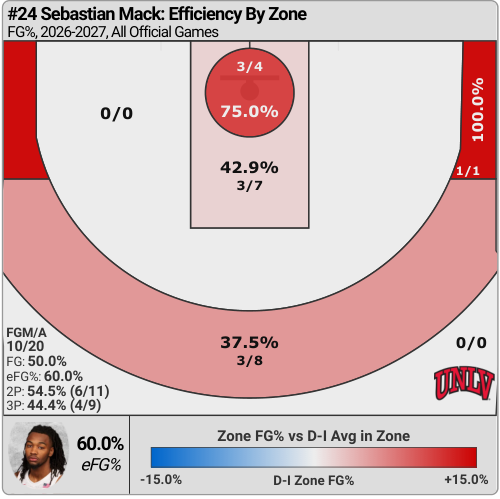
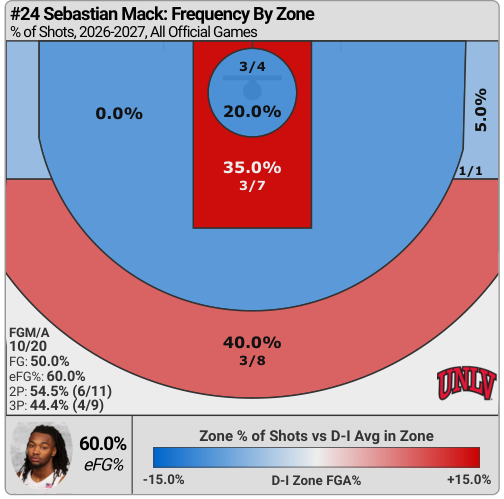
| Shot Zone | FGM–FGA | FG% | Share of Attempts |
|---|---|---|---|
| At the Rim | 3–4 | 75.0% | 20.0% |
| Other Paint Shots | 3–7 | 42.9% | 35.0% |
| Midrange | 0–0 | — | 0.0% |
| Above-the-Break 3s | 3–8 | 37.5% | 40.0% |
| Corner 3s | 1–1 | 100.0% | 5.0% |
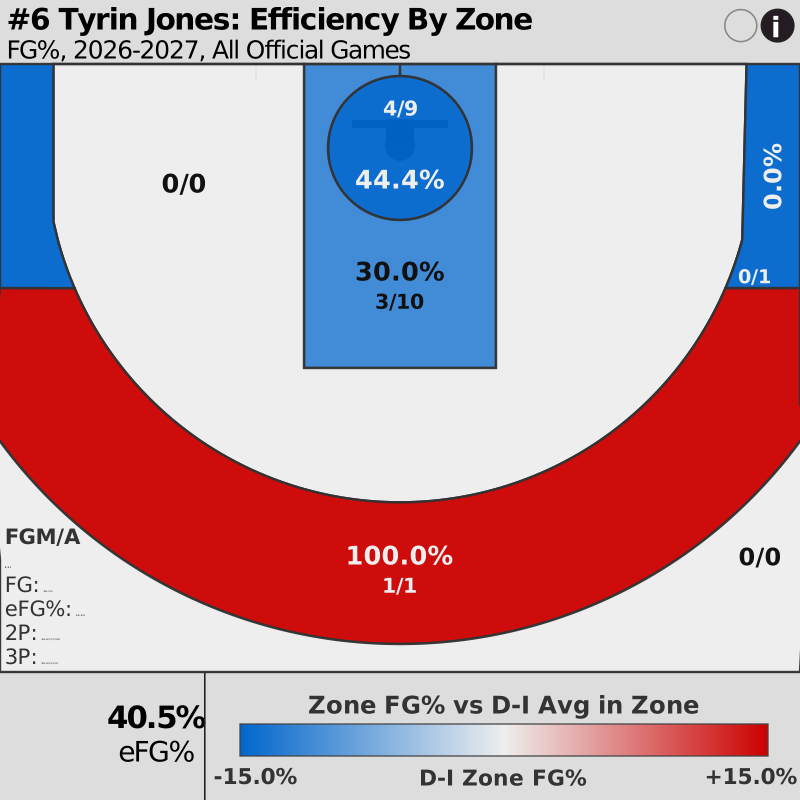
Tyrin Jones
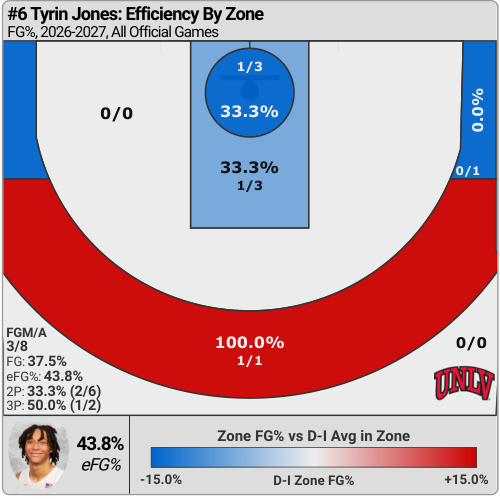
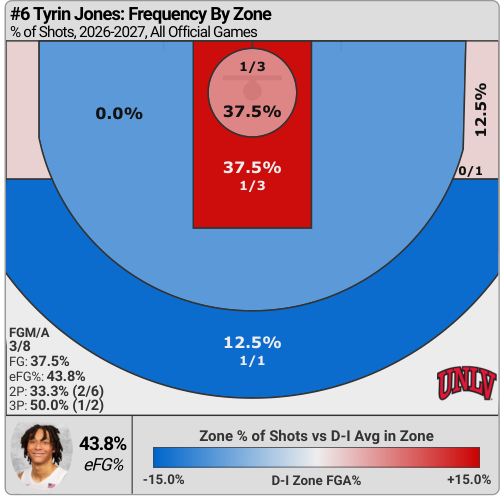
| Shot Zone | FGM–FGA | FG% | Share of Attempts |
|---|---|---|---|
| At the Rim | 1–3 | 33.3% | 37.5% |
| Other Paint Shots | 1–3 | 33.3% | 37.5% |
| Midrange | 0–0 | — | 0.0% |
| Above-the-Break 3s | 1–1 | 100.0% | 12.5% |
| Corner 3s | 0–1 | 0.0% | 12.5% |
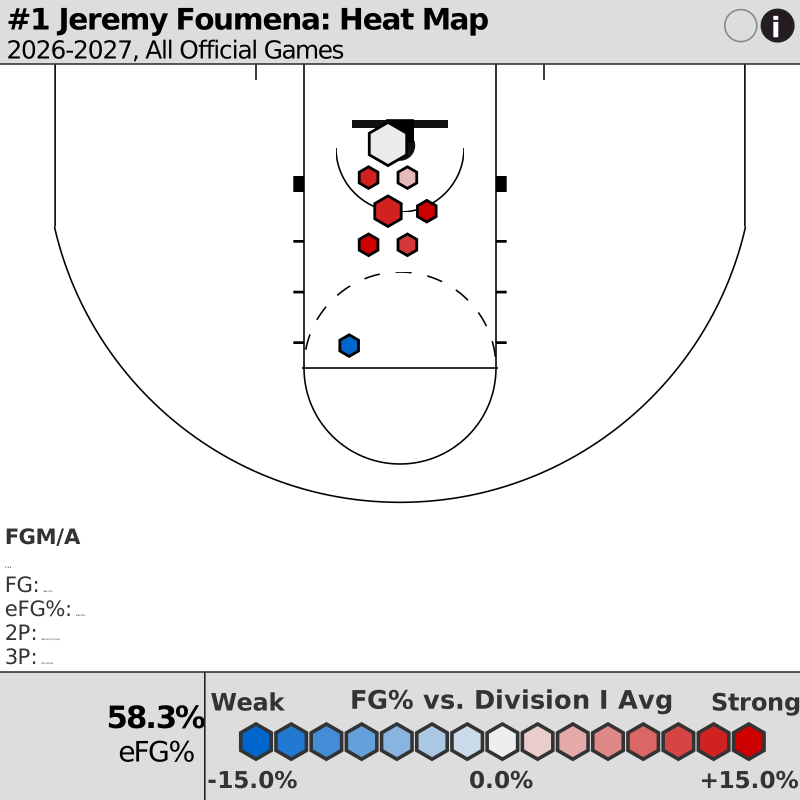
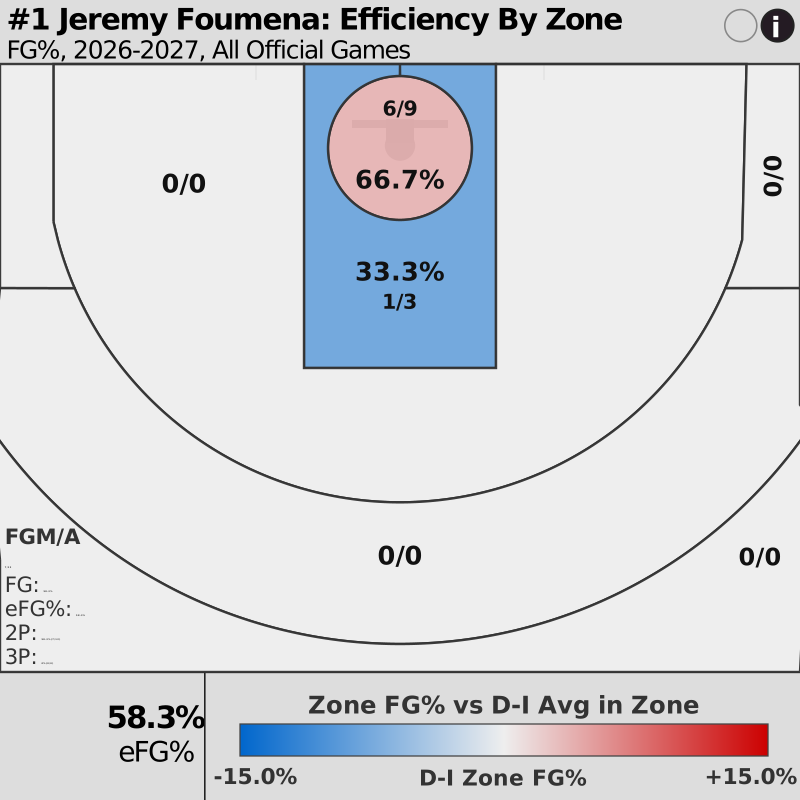
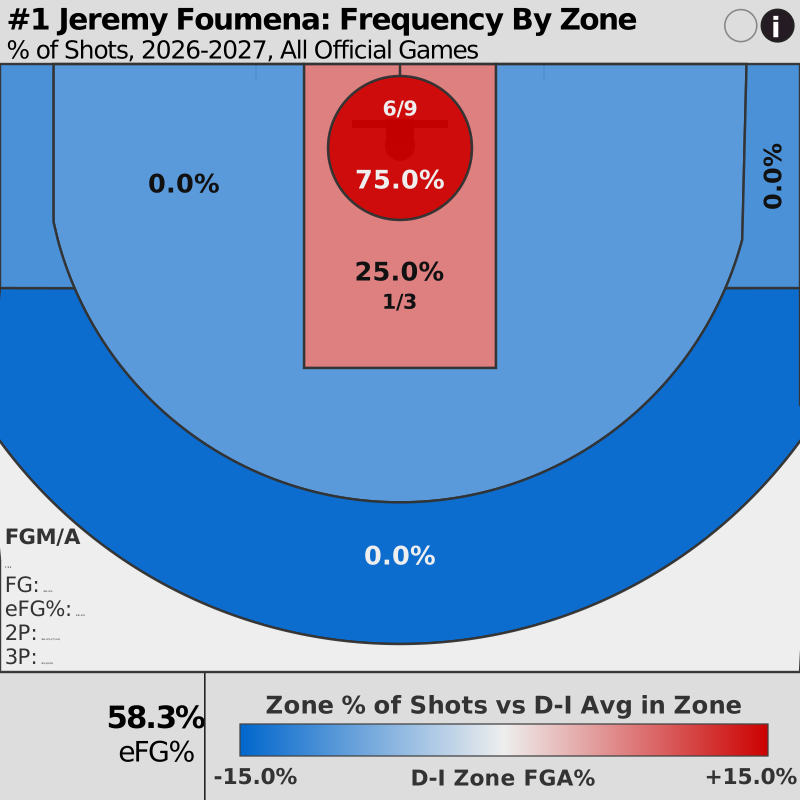
Jeremy Foumena
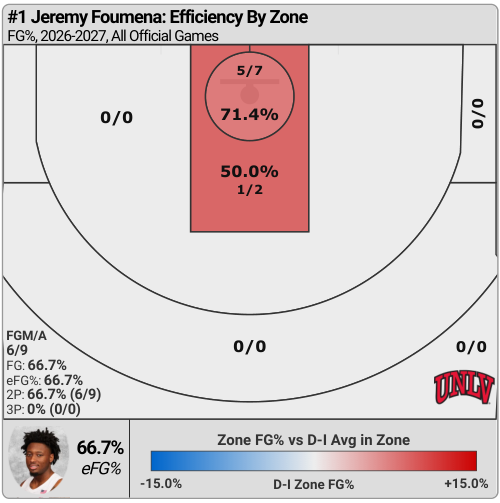
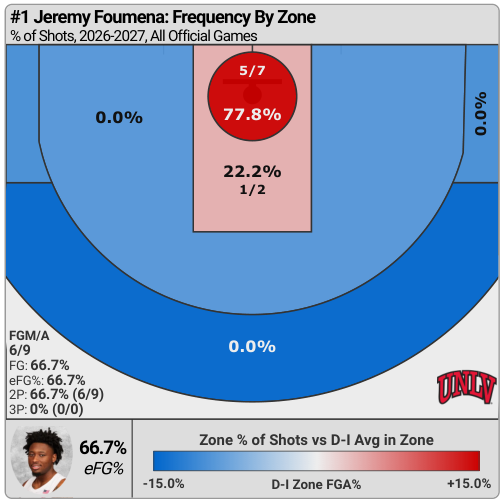
| Shot Zone | FGM–FGA | FG% | Share of Attempts |
|---|---|---|---|
| At the Rim | 5–7 | 71.4% | 77.8% |
| Other Paint Shots | 1–2 | 50.0% | 22.2% |
| Midrange | 0–0 | — | 0.0% |
| Above-the-Break 3s | 0–0 | — | 0.0% |
| Corner 3s | 0–0 | — | 0.0% |
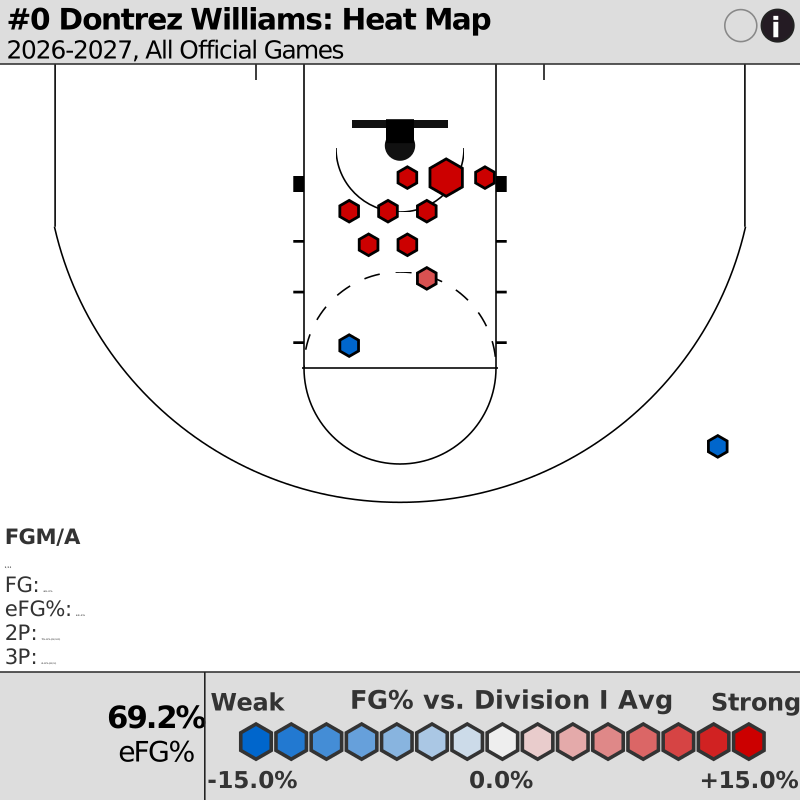
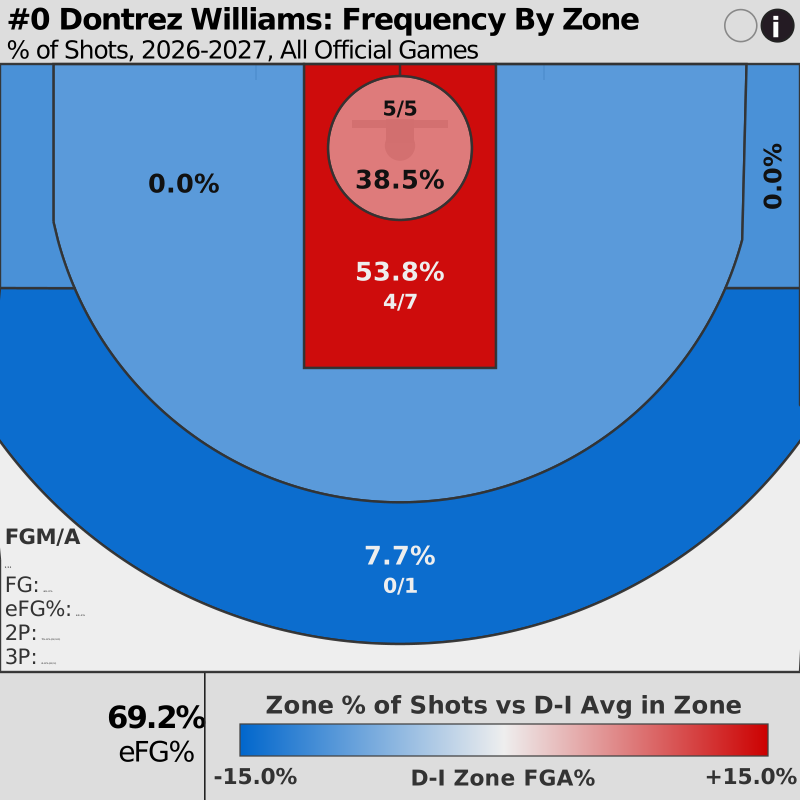
Dontrez Williams
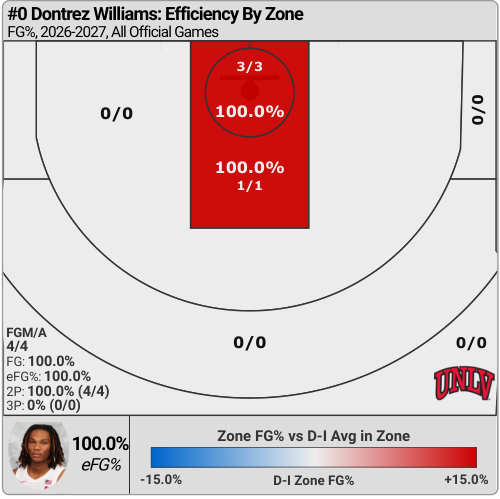

| Shot Zone | FGM–FGA | FG% | Share of Attempts |
|---|---|---|---|
| At the Rim | 3–3 | 100.0% | 75.0% |
| Other Paint Shots | 1–1 | 100.0% | 25.0% |
| Midrange | 0–0 | — | 0.0% |
| Above-the-Break 3s | 0–0 | — | 0.0% |
| Corner 3s | 0–0 | — | 0.0% |
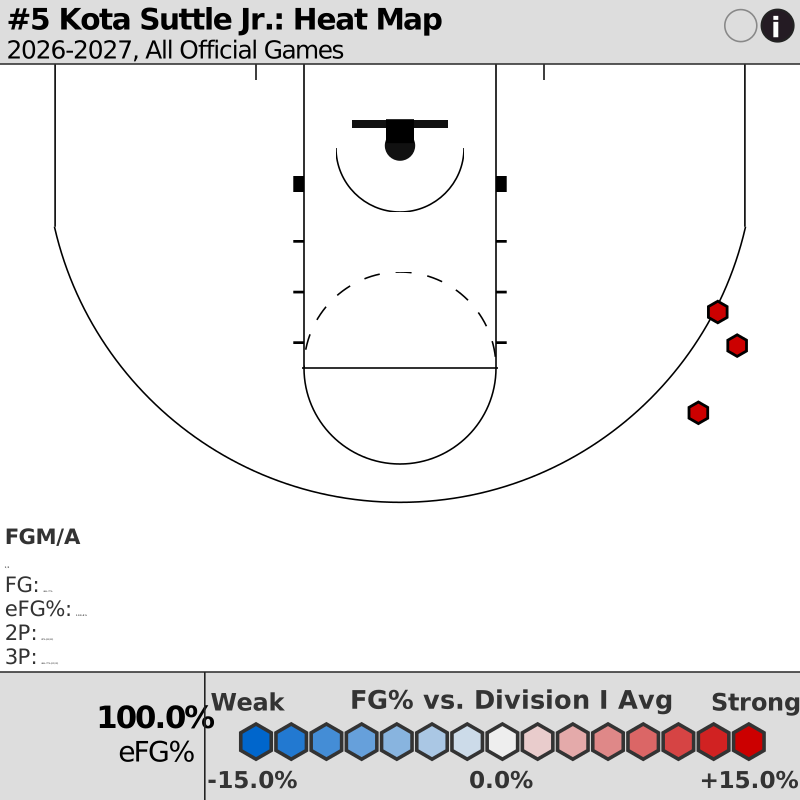
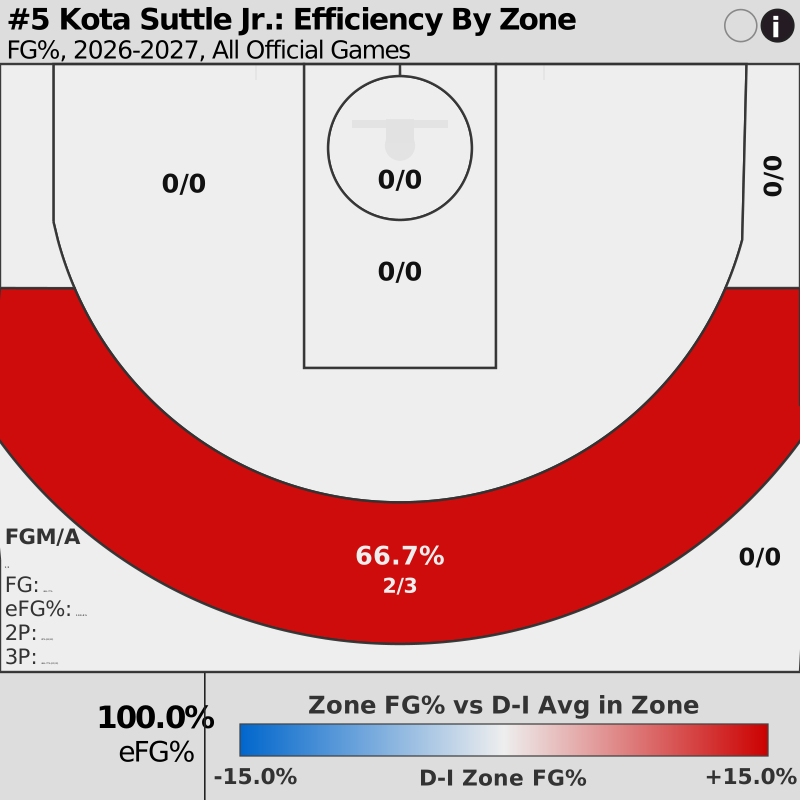
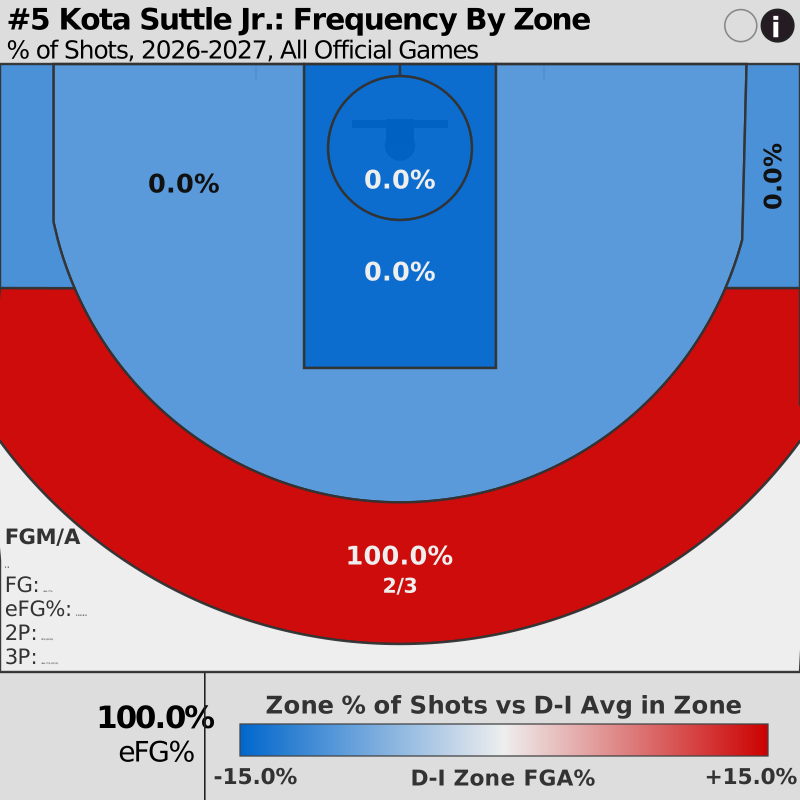
Kota Suttle Jr.
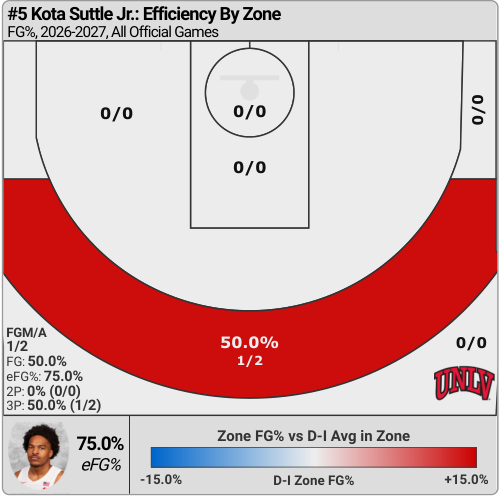
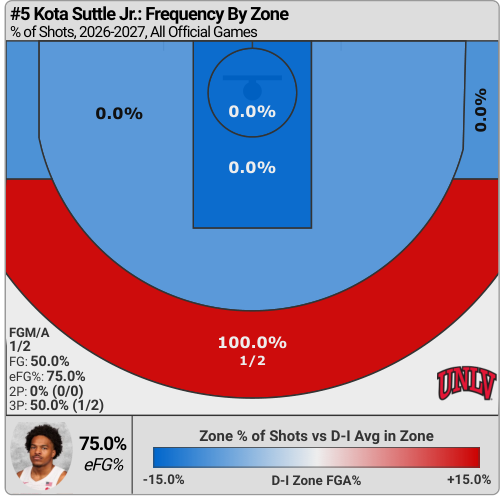
| Shot Zone | FGM–FGA | FG% | Share of Attempts |
|---|---|---|---|
| At the Rim | 0–0 | — | 0.0% |
| Other Paint Shots | 0–0 | — | 0.0% |
| Midrange | 0–0 | — | 0.0% |
| Above-the-Break 3s | 1–2 | 50.0% | 100.0% |
| Corner 3s | 0–0 | — | 0.0% |
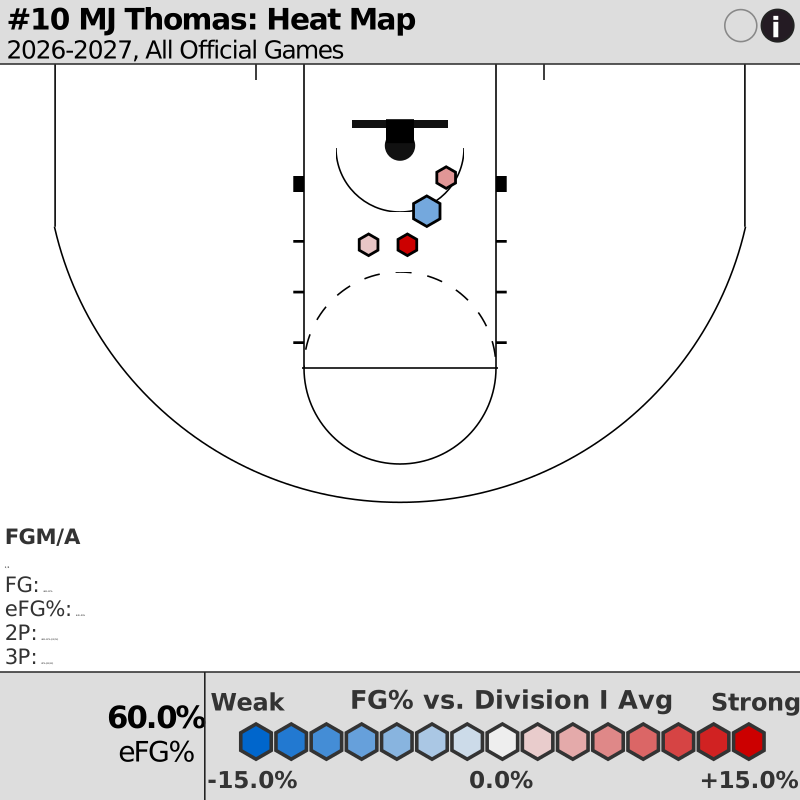
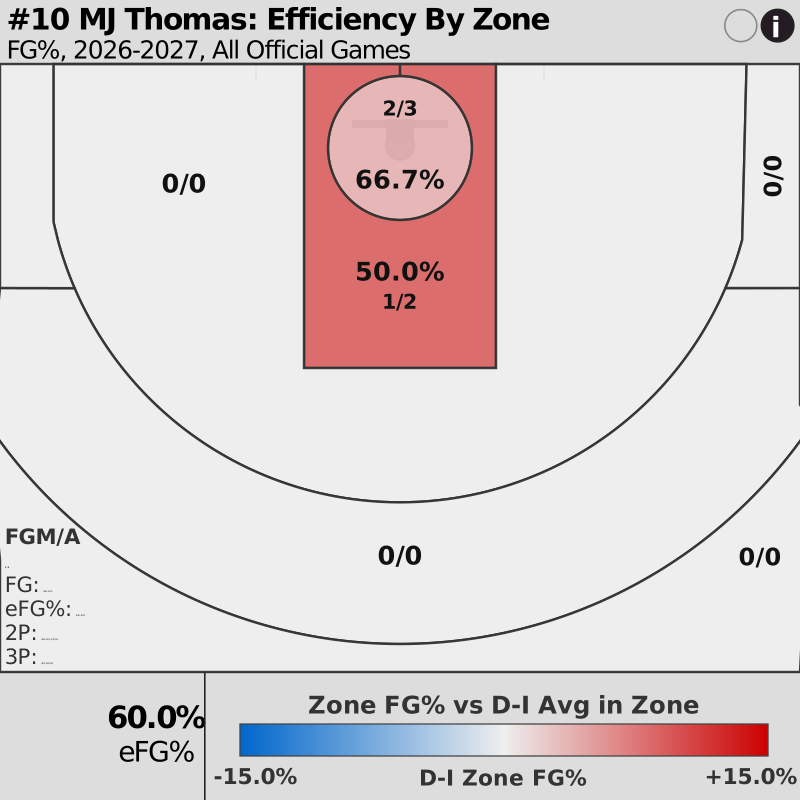
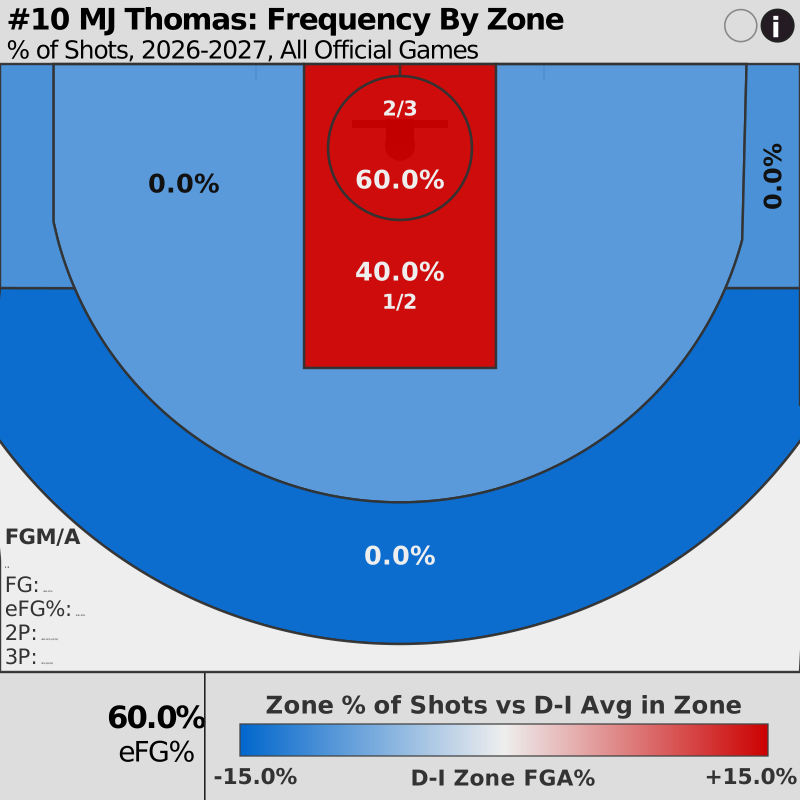
MJ Thomas
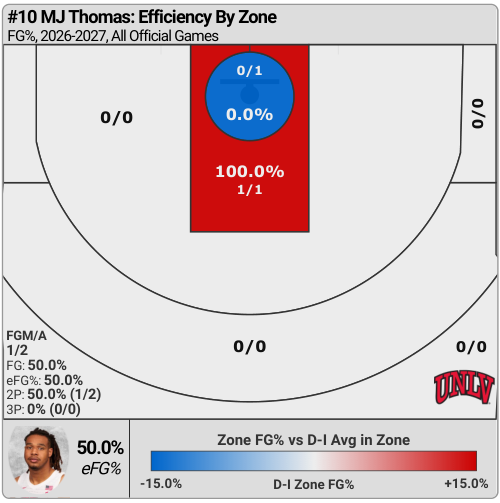
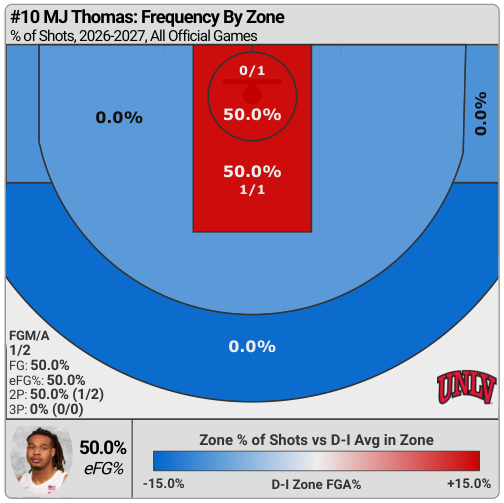
| Shot Zone | FGM–FGA | FG% | Share of Attempts |
|---|---|---|---|
| At the Rim | 0–1 | 0.0% | 50.0% |
| Other Paint Shots | 1–1 | 100.0% | 50.0% |
| Midrange | 0–0 | — | 0.0% |
| Above-the-Break 3s | 0–0 | — | 0.0% |
| Corner 3s | 0–0 | — | 0.0% |
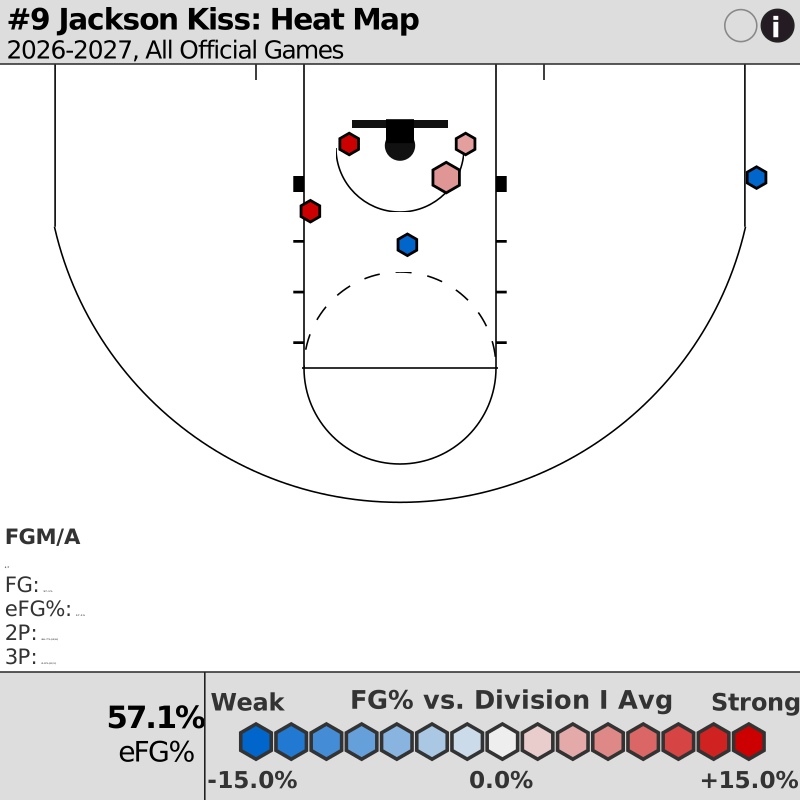
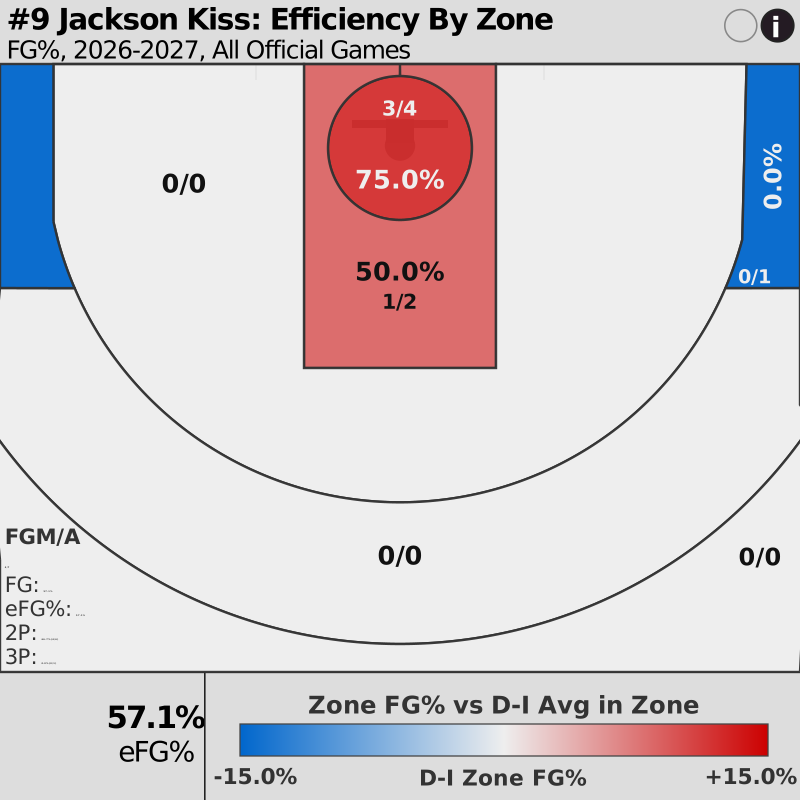
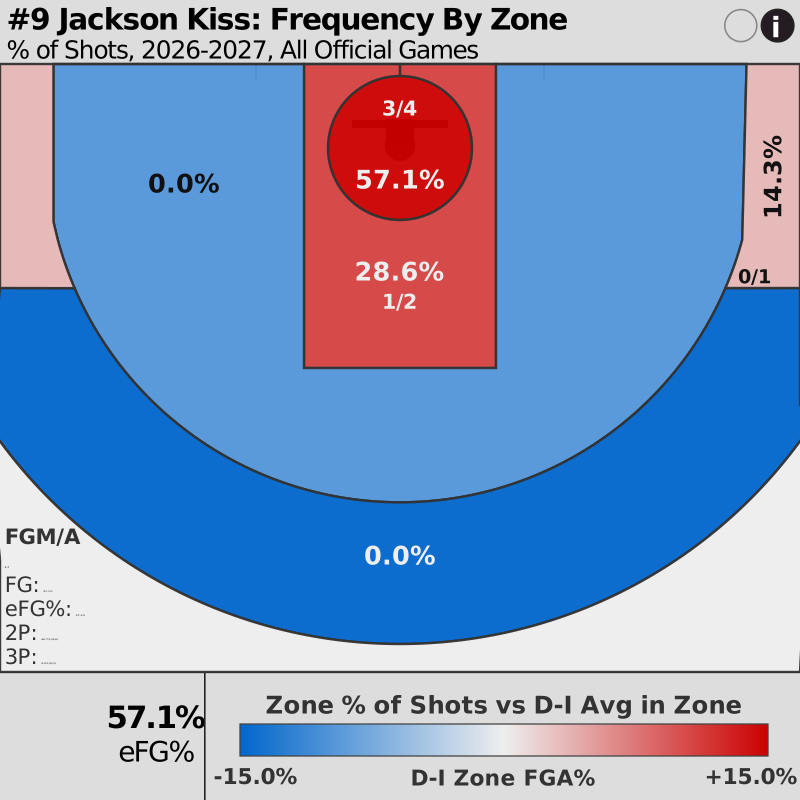
Jackson Kiss
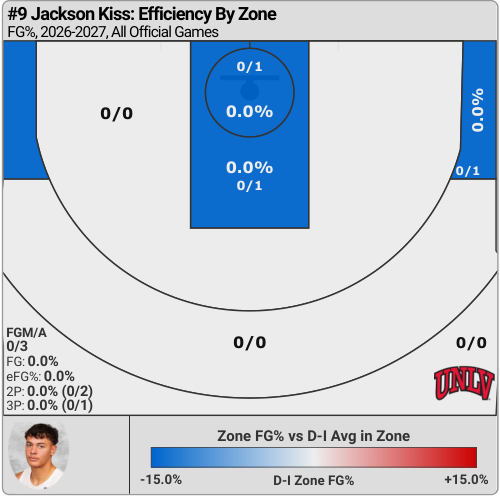
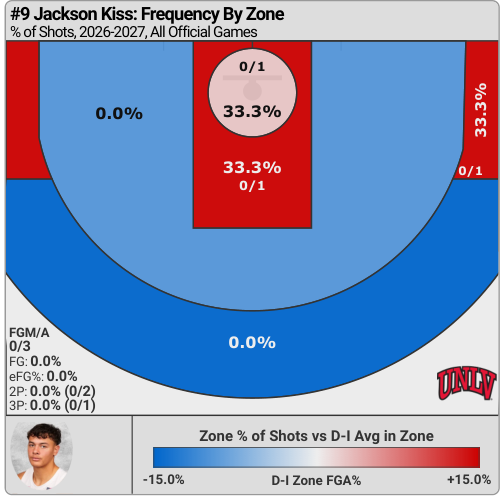
| Shot Zone | FGM–FGA | FG% | Share of Attempts |
|---|---|---|---|
| At the Rim | 0–1 | 0.0% | 33.3% |
| Other Paint Shots | 0–1 | 0.0% | 33.3% |
| Midrange | 0–0 | — | 0.0% |
| Above-the-Break 3s | 0–0 | — | 0.0% |
| Corner 3s | 0–1 | 0.0% | 33.3% |
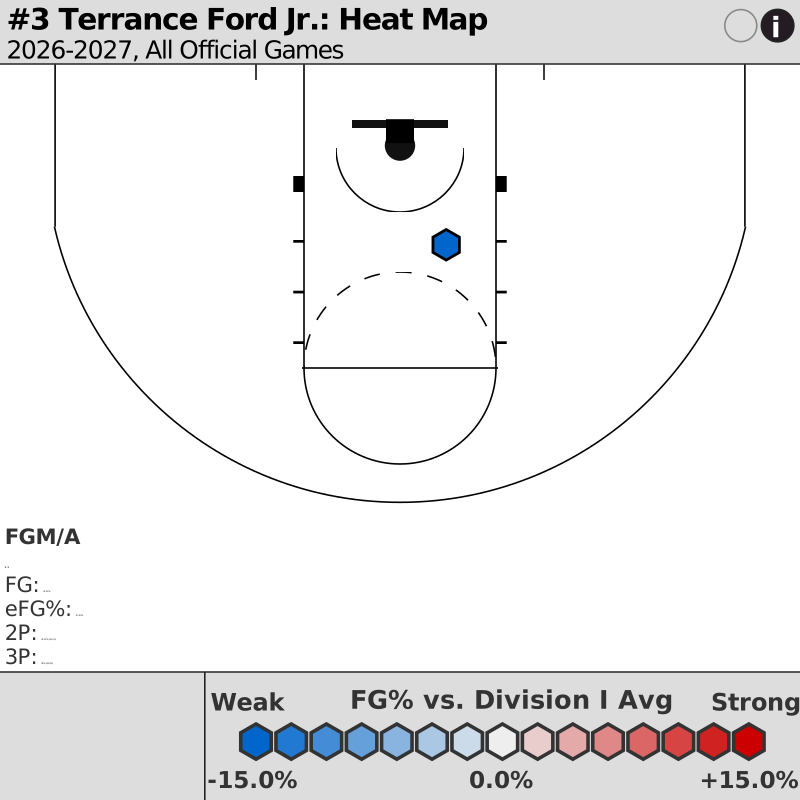
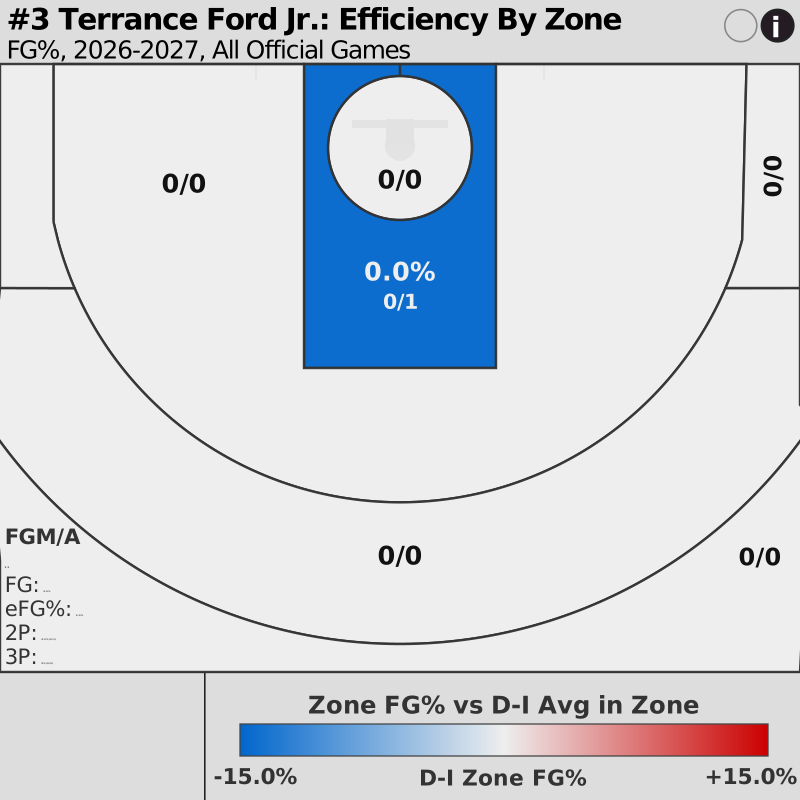
Terrance Ford Jr.
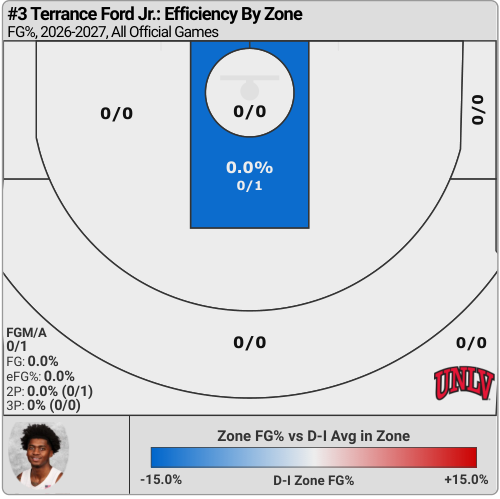
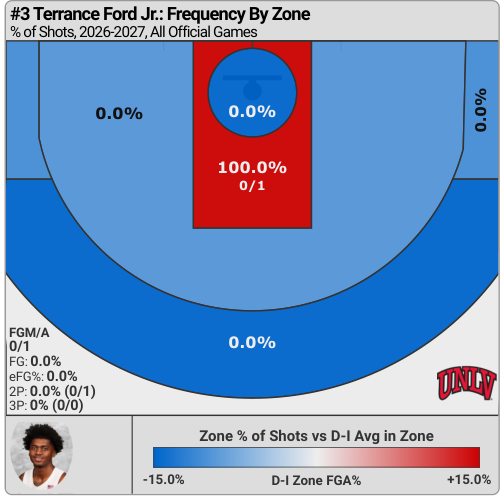
| Shot Zone | FGM–FGA | FG% | Share of Attempts |
|---|---|---|---|
| At the Rim | 0–0 | — | 0.0% |
| Other Paint Shots | 0–1 | 0.0% | 100.0% |
| Midrange | 0–0 | — | 0.0% |
| Above-the-Break 3s | 0–0 | — | 0.0% |
| Corner 3s | 0–0 | — | 0.0% |
| Player | GP | MIN | FG | 3PT | FT | OREB | DREB | REB | PF | PTS | AST | TO | STL | BLK | PPG | RPG | APG |
|---|---|---|---|---|---|---|---|---|---|---|---|---|---|---|---|---|---|
| Sebastian Mack | 2 | 67 | 17-33 | 4-12 | 10-11 | 1 | 6 | 7 | 6 | 48 | 5 | 10 | 1 | 0 | 24.0 | 3.5 | 2.5 |
| Cam Miles | 2 | 73 | 8-22 | 6-16 | 13-13 | 2 | 4 | 6 | 2 | 35 | 6 | 3 | 3 | 2 | 17.5 | 3.0 | 3.0 |
| Tyrin Jones | 2 | 67 | 8-21 | 1-2 | 12-16 | 7 | 6 | 13 | 2 | 29 | 2 | 2 | 4 | 8 | 14.5 | 6.5 | 1.0 |
| Dontrez Williams | 2 | 52 | 9-13 | 0-1 | 4-9 | 1 | 4 | 5 | 4 | 22 | 2 | 1 | 1 | 1 | 11.0 | 2.5 | 1.0 |
| Jeremy Foumena | 2 | 32 | 7-12 | 0-0 | 1-3 | 8 | 5 | 13 | 4 | 15 | 0 | 2 | 0 | 0 | 7.5 | 6.5 | 0.0 |
| Jackson Kiss | 2 | 38 | 4-7 | 0-1 | 3-5 | 2 | 6 | 8 | 7 | 11 | 2 | 3 | 3 | 1 | 5.5 | 4.0 | 1.0 |
| Kota Suttle Jr. | 2 | 29 | 2-3 | 2-3 | 0-0 | 0 | 3 | 3 | 7 | 6 | 1 | 1 | 2 | 0 | 3.0 | 1.5 | 0.5 |
| MJ Thomas | 2 | 24 | 3-5 | 0-0 | 0-1 | 6 | 3 | 9 | 6 | 6 | 0 | 0 | 3 | 0 | 3.0 | 4.5 | 0.0 |
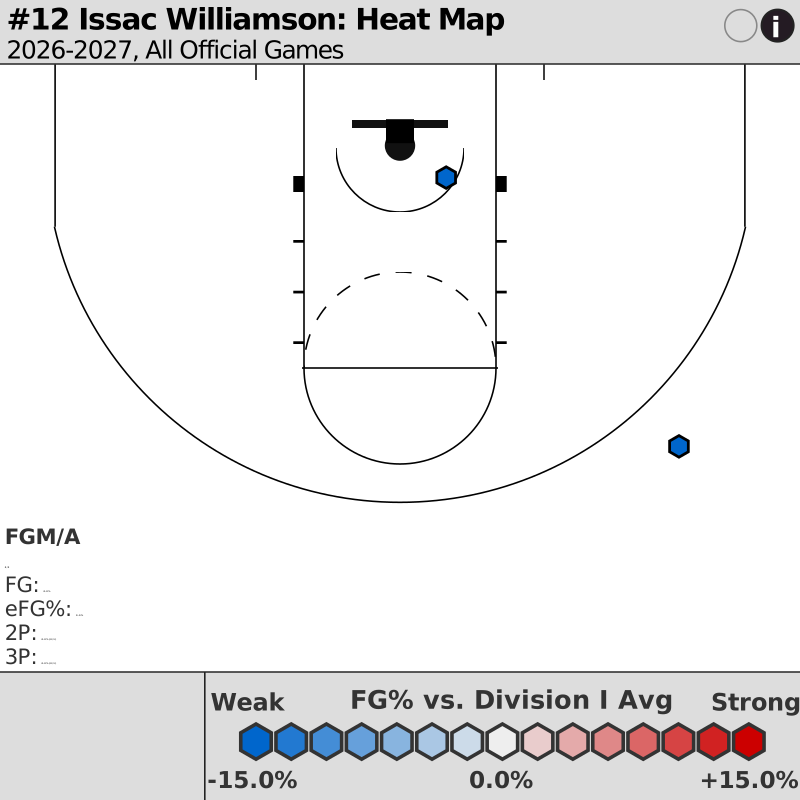
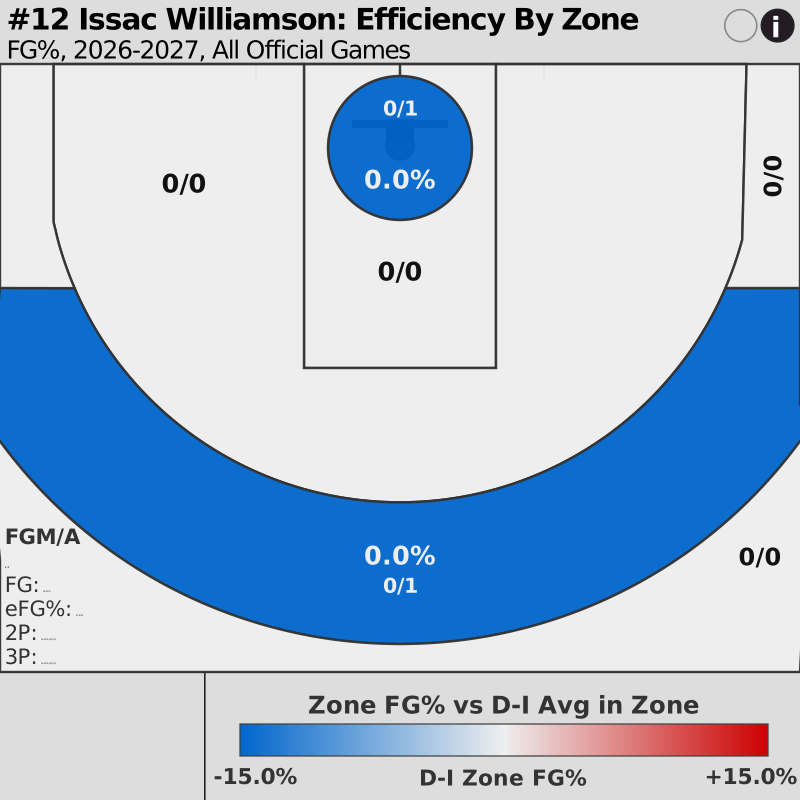
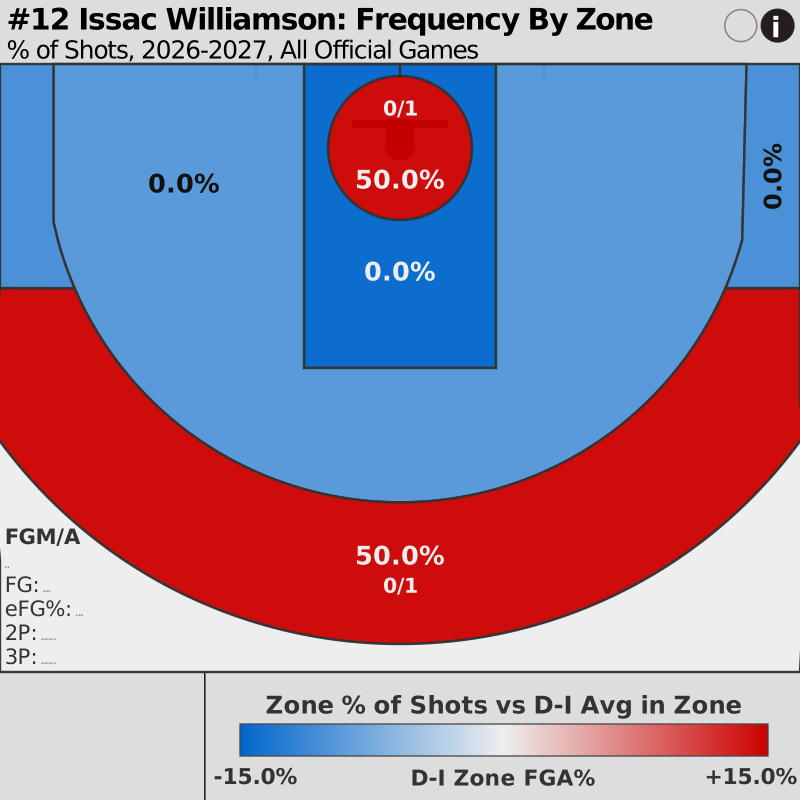
| Issac Williamson | 1 | 15 | 0-2 | 0-1 | 5-6 | 0 | 3 | 3 | 1 | 5 | 0 | 1 | 0 | 0 | 5.0 | 3.0 | 0.0 |
| Terrance Ford Jr. | 1 | 3 | 0-1 | 0-0 | 0-0 | 0 | 0 | 0 | 1 | 0 | 0 | 0 | 0 | 0 | 0.0 | 0.0 | 0.0 |
| Statistic | UNLV / game | Opponents / game |
|---|---|---|
| Points / Game | 88.5 | 78.0 |
| Assists / Game | 9.0 | 14.0 |
| ORebs / Game | 14.5 | 6.5 |
| DRebs / Game | 23.0 | 20.5 |
| Steals / Game | 8.5 | 5.0 |
| Blocks / Game | 6.0 | 1.5 |
| Turnovers / Game | 11.5 | 14.5 |
| PFs / Game | 20.0 | 24.0 |
| FGAs / Game | 59.5 | 55.0 |
| Field Goal Pct | 48.7% | 50.0% |
| 2PAs / Game | 41.5 | 33.5 |
| 2-Point Pct | 54.2% | 58.2% |
| 3PAs / Game | 18.0 | 21.5 |
| 3-Point Pct | 36.1% | 37.2% |
| FTAs / Game | 32.0 | 21.5 |
| Free Throw Pct | 75.0% | 69.8% |
| Statistic | UNLV | Opponents |
|---|---|---|
| Net Rating | 14.8 | -14.8 |
| Offensive Rating | 124.7 | 109.9 |
| Defensive Rating | 109.9 | 124.7 |
| Pace | 70.9 | 70.9 |
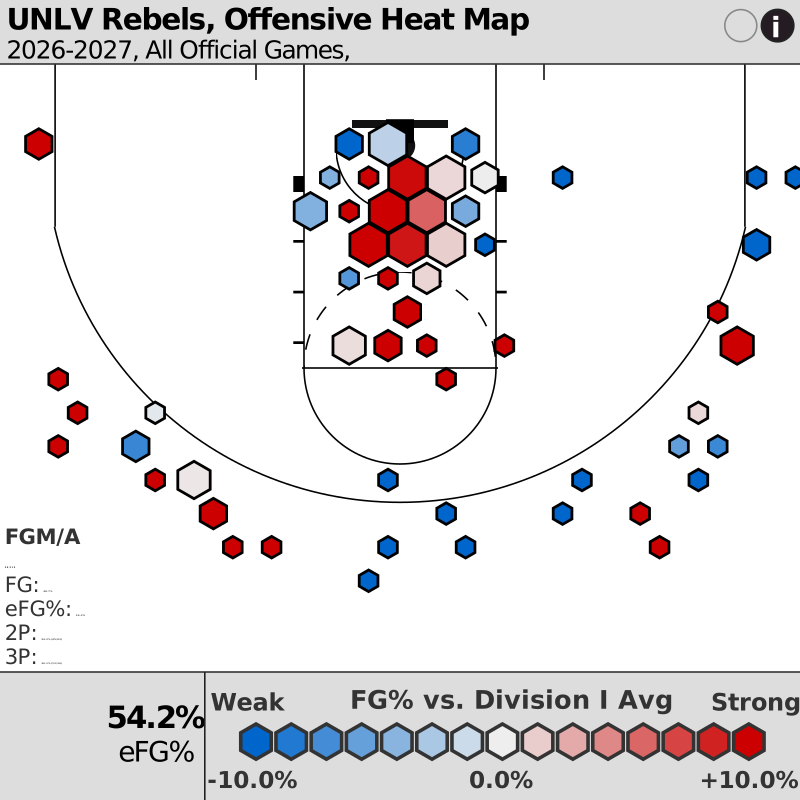
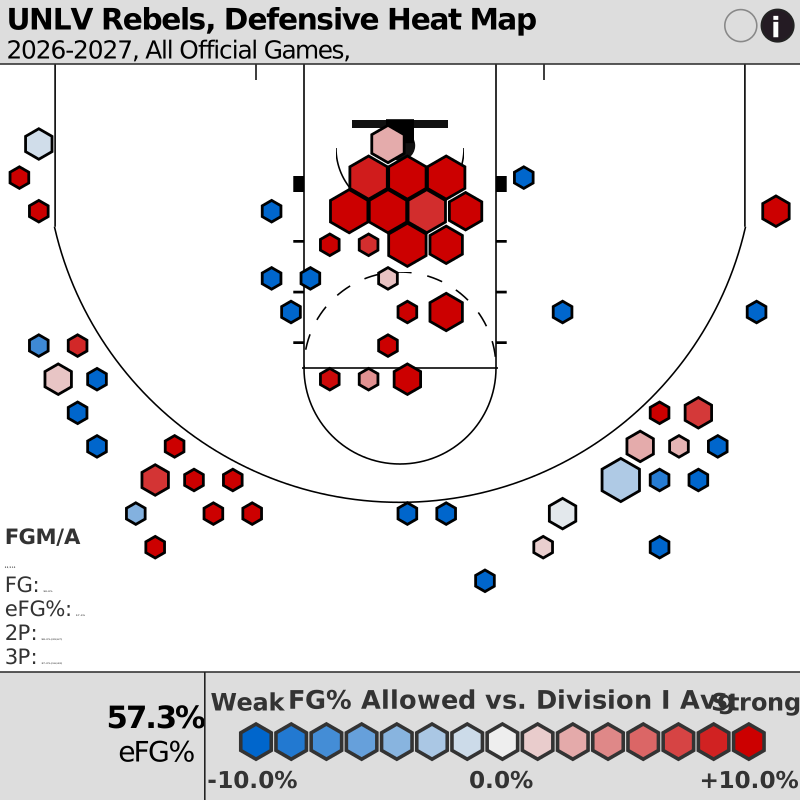
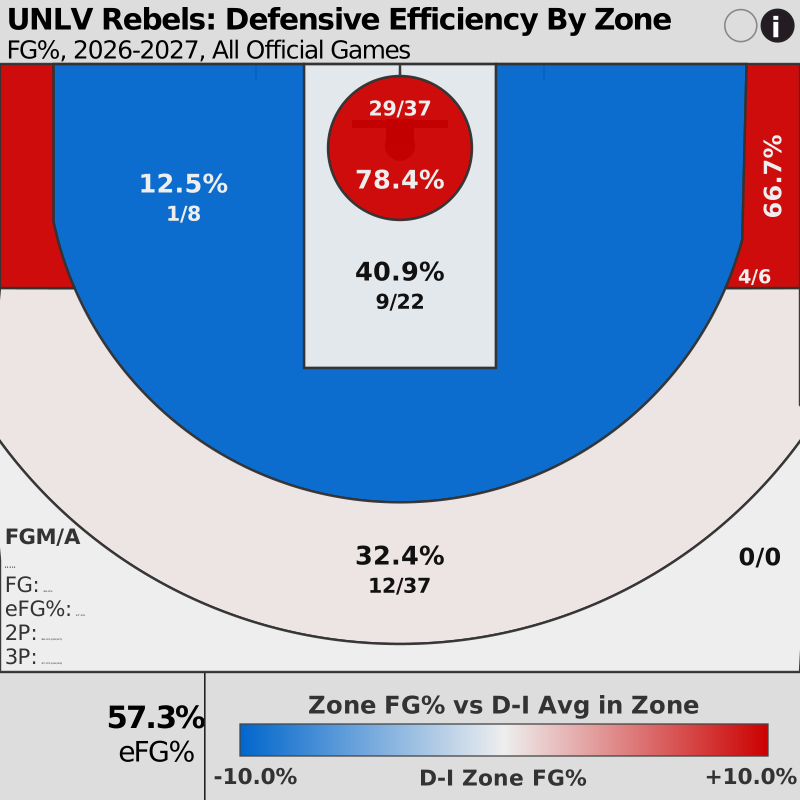
| Effective FG% | 54.2% | 57.3% |
| Off Rebound Pct | 41.4% | 22.0% |
| Turnover Pct | 13.5% | 18.4% |
| FT Attempt Rate | 53.8% | 39.1% |
| Statistic | UNLV | Opponents |
|---|---|---|
| Fast Break Points / Game | 20.5 | 9.5 |
| % Pts on Fast Break | 23.2% | 12.2% |
| Paint Points / Game | 44.0 | 39.0 |
| % Pts in Paint | 49.7% | 50.0% |
| 2nd Chance Points / Game | 17.0 | 6.0 |
| % Pts on 2nd Chance | 19.2% | 7.7% |
| Points off TOVs / Game | 14.0 | 16.5 |
| Bench / Game | 14.0 | 12.5 |
| Statistic | UNLV | Opponents |
|---|---|---|
| Points / Game | 88.5 | 78.0 |
| Assists / Game | 9.0 | 14.0 |
| ORebs / Game | 14.5 | 6.5 |
| DRebs / Game | 23.0 | 20.5 |
| Steals / Game | 8.5 | 5.0 |
| Blocks / Game | 6.0 | 1.5 |
| Turnovers / Game | 11.5 | 14.5 |
| PFs / Game | 20.0 | 24.0 |
| Statistic | UNLV | Opponents |
|---|---|---|
| FGAs / Game | 59.5 | 55.0 |
| Field Goal Pct | 48.7% | 50.0% |
| 2PAs / Game | 41.5 | 33.5 |
| 2-Point Pct | 54.2% | 58.2% |
| 3PAs / Game | 18.0 | 21.5 |
| 3-Point Pct | 36.1% | 37.2% |
| FTAs / Game | 32.0 | 21.5 |
| Free Throw Pct | 75.0% | 69.8% |
| Statistic | UNLV | Opponents |
|---|---|---|
| Offensive Rating | 124.7 | 109.9 |
| True Shooting % | 60.1% | 60.5% |
| 3-Point Att Rate | 30.3% | 39.1% |
| FT Attempt Rate | 53.8% | 39.1% |
| Assist Pct | 31.0% | 50.9% |
| Turnover Pct | 13.5% | 18.4% |
| Ast/Tov Ratio | 0.78x | 0.97x |
| PF Drawn / Game | 24.0 | 20.0 |
| Statistic | UNLV | Opponents |
|---|---|---|
| Defensive Rating | 109.9 | 124.7 |
| Def Rebound Pct | 78.0% | 58.6% |
| Steal Pct | 11.9% | 7.1% |
| Block Pct | 17.9% | 3.6% |
| Hakeem Pct | 29.8% | 10.7% |
| PF Efficiency | 0.73x | 0.27x |
| Steals / PF | 0.43x | 0.21x |
| Blocks / PF | 0.30x | 0.06x |
| Player | GS | GP | MINS | PTS/40 | 2P% | 3P% | AST/40 | ORB/40 | DRB/40 | REB/40 | STL/40 | BLK/40 | TOV/40 | PF/40 | OPF/40 | PFD/40 | +/- |
|---|---|---|---|---|---|---|---|---|---|---|---|---|---|---|---|---|---|
| Cam Miles | 2 | 2 | 73 | 19.2 | 33.3% | 37.5% | 3.3 | 1.1 | 2.2 | 3.3 | 1.6 | 1.1 | 1.6 | 1.1 | 0.0 | 4.9 | 20 |
| Sebastian Mack | 2 | 2 | 67 | 28.5 | 61.9% | 33.3% | 3.0 | 0.6 | 3.6 | 4.2 | 0.6 | 0.0 | 5.9 | 3.6 | 1.8 | 5.9 | 26 |
| Tyrin Jones | 2 | 2 | 67 | 17.3 | 36.8% | 50.0% | 1.2 | 4.2 | 3.6 | 7.7 | 2.4 | 4.8 | 1.2 | 1.2 | 0.0 | 6.0 | 13 |
| Dontrez Williams | 2 | 2 | 52 | 17.0 | 75.0% | 0.0% | 1.5 | 0.8 | 3.1 | 3.9 | 0.8 | 0.8 | 0.8 | 3.1 | 0.0 | 3.9 | 13 |
| Jackson Kiss | 0 | 2 | 38 | 11.7 | 66.7% | 0.0% | 2.1 | 2.1 | 6.4 | 8.5 | 3.2 | 1.1 | 3.2 | 7.4 | 1.1 | 4.2 | 6 |
| Jeremy Foumena | 2 | 2 | 32 | 18.6 | 58.3% | 0.0 | 9.9 | 6.2 | 16.1 | 0.0 | 0.0 | 2.5 | 4.9 | 1.2 | 3.7 | 11 | |
| Kota Suttle Jr. | 0 | 2 | 29 | 8.2 | 66.7% | 1.4 | 0.0 | 4.1 | 4.1 | 2.7 | 0.0 | 1.4 | 9.6 | 0.0 | 0.0 | 6 | |
| MJ Thomas | 0 | 2 | 24 | 10.0 | 60.0% | 0.0 | 10.0 | 5.0 | 15.0 | 5.0 | 0.0 | 0.0 | 10.0 | 0.0 | 5.0 | 5 | |
| Issac Williamson | 0 | 1 | 15 | 13.7 | 0.0% | 0.0% | 0.0 | 0.0 | 8.2 | 8.2 | 0.0 | 0.0 | 2.7 | 2.7 | 0.0 | 11.0 | 11 |
| Terrance Ford Jr. | 0 | 1 | 3 | 0.0 | 0.0% | 0.0 | 0.0 | 0.0 | 0.0 | 0.0 | 0.0 | 0.0 | 14.1 | 0.0 | 0.0 | -6 |
| Player | GS | GP | MINS | FGA/40 | FG% | 2PA/40 | 2P% | 3PA/40 | 3P% | FTA/40 | FT% | eFG% | TS% | 3PAr |
|---|---|---|---|---|---|---|---|---|---|---|---|---|---|---|
| Cam Miles | 2 | 2 | 73 | 12.0 | 36.4% | 3.3 | 33.3% | 8.8 | 37.5% | 7.1 | 100.0% | 50.0% | 63.2% | 72.7% |
| Sebastian Mack | 2 | 2 | 67 | 19.6 | 51.5% | 12.5 | 61.9% | 7.1 | 33.3% | 6.5 | 90.9% | 57.6% | 63.5% | 36.4% |
| Tyrin Jones | 2 | 2 | 67 | 12.5 | 38.1% | 11.3 | 36.8% | 1.2 | 50.0% | 9.5 | 75.0% | 40.5% | 51.8% | 9.5% |
| Dontrez Williams | 2 | 2 | 52 | 10.0 | 69.2% | 9.3 | 75.0% | 0.8 | 0.0% | 7.0 | 44.4% | 69.2% | 64.7% | 7.7% |
| Jackson Kiss | 0 | 2 | 38 | 7.4 | 57.1% | 6.4 | 66.7% | 1.1 | 0.0% | 5.3 | 60.0% | 57.1% | 59.8% | 14.3% |
| Jeremy Foumena | 2 | 2 | 32 | 14.8 | 58.3% | 14.8 | 58.3% | 0.0 | 3.7 | 33.3% | 58.3% | 56.4% | 0.0% | |
| Kota Suttle Jr. | 0 | 2 | 29 | 4.1 | 66.7% | 0.0 | 4.1 | 66.7% | 0.0 | 100.0% | 100.0% | 100.0% | ||
| MJ Thomas | 0 | 2 | 24 | 8.4 | 60.0% | 8.4 | 60.0% | 0.0 | 1.7 | 0.0% | 60.0% | 55.6% | 0.0% | |
| Issac Williamson | 0 | 1 | 15 | 5.5 | 0.0% | 2.7 | 0.0% | 2.7 | 0.0% | 16.4 | 83.3% | 0.0% | 54.3% | 50.0% |
| Terrance Ford Jr. | 0 | 1 | 3 | 14.1 | 0.0% | 14.1 | 0.0% | 0.0 | 0.0 | 0.0% | 0.0% | 0.0% |
Exhibition player statistics
Utah · Oct 7, 2026
| Player | MIN | PTS | FG | 3PT | FT | REB | AST | TO | STL | BLK | OREB | DREB | PF |
|---|---|---|---|---|---|---|---|---|---|---|---|---|---|
| Sebastian Mack | 31 | 25 | 10-22 | 2-7 | 3-4 | 8 | 2 | 1 | 1 | 0 | 2 | 6 | 3 |
| Cam Miles | 36 | 16 | 6-14 | 3-11 | 1-2 | 1 | 0 | 3 | 0 | 0 | 1 | 0 | 3 |
| Mj Thomas | 22 | 7 | 2-2 | 0-0 | 3-4 | 10 | 2 | 2 | 1 | 2 | 5 | 5 | 1 |
| Terrance Ford Jr. | 33 | 5 | 1-8 | 1-6 | 2-3 | 0 | 1 | 3 | 1 | 0 | 0 | 0 | 2 |
| Jackson Kiss | 22 | 4 | 1-4 | 0-1 | 2-3 | 8 | 5 | 4 | 3 | 0 | 1 | 7 | 1 |
| Kota Suttle Jr. | 26 | 5 | 1-3 | 1-2 | 2-2 | 3 | 3 | 3 | 0 | 0 | 0 | 3 | 5 |
| Jalen Cunningham | 3 | 3 | 1-1 | 1-1 | 0-0 | 0 | 0 | 0 | 0 | 0 | 0 | 0 | 1 |
| Jeremy Foumena | 14 | 2 | 0-2 | 0-0 | 2-8 | 9 | 0 | 1 | 0 | 1 | 5 | 4 | 2 |
| Moustapha Loum | 13 | 2 | 1-2 | 0-0 | 0-3 | 3 | 0 | 0 | 1 | 2 | 1 | 2 | 1 |
BYU · Oct 24, 2026
| Player | MIN | PTS | FG | 3PT | FT | REB | AST | TO | STL | BLK | OREB | DREB | PF |
|---|---|---|---|---|---|---|---|---|---|---|---|---|---|
| Sebastian Mack | 33 | 26 | 10-20 | 1-4 | 5-5 | 3 | 3 | 1 | 1 | 1 | 0 | 3 | 4 |
| Cam Miles | 36 | 15 | 4-12 | 2-6 | 5-6 | 4 | 4 | 5 | 2 | 0 | 1 | 3 | 1 |
| Jeremy Foumena | 23 | 10 | 5-7 | 0-0 | 0-1 | 9 | 2 | 3 | 0 | 0 | 4 | 5 | 4 |
| Dontrez Williams | 33 | 9 | 3-9 | 0-2 | 3-5 | 9 | 1 | 0 | 0 | 0 | 3 | 6 | 4 |
| Jackson Kiss | 32 | 2 | 1-4 | 0-1 | 0-2 | 3 | 1 | 5 | 1 | 3 | 1 | 2 | 1 |
| Jalen Cunningham | 14 | 9 | 3-3 | 3-3 | 0-0 | 0 | 0 | 0 | 1 | 0 | 0 | 0 | 1 |
| Kota Suttle Jr. | 16 | 4 | 1-3 | 0-2 | 2-2 | 4 | 1 | 2 | 0 | 0 | 2 | 2 | 1 |
| Moustapha Loum | 13 | 2 | 1-1 | 0-0 | 0-0 | 4 | 0 | 0 | 0 | 1 | 2 | 2 | 0 |
Missouri · Oct 29, 2026
| Player | MIN | PTS | FG | 3PT | FT | REB | AST | TO | STL | BLK | OREB | DREB | PF |
|---|---|---|---|---|---|---|---|---|---|---|---|---|---|
| Tyrin Jones | 23 | 21 | 8-14 | 0-0 | 5-6 | 8 | 2 | 4 | 4 | 2 | 5 | 3 | 0 |
| Sebastian Mack | 33 | 19 | 7-19 | 3-8 | 2-5 | 3 | 2 | 2 | 0 | 0 | 0 | 3 | 2 |
| Cam Miles | 38 | 16 | 5-13 | 3-5 | 3-4 | 9 | 10 | 4 | 3 | 0 | 1 | 8 | 2 |
| Jeremy Foumena | 13 | 10 | 5-6 | 0-0 | 0-1 | 4 | 1 | 0 | 0 | 0 | 2 | 2 | 2 |
| Dontrez Williams | 29 | 4 | 1-5 | 0-1 | 2-4 | 2 | 0 | 1 | 2 | 0 | 1 | 1 | 4 |
| Mj Thomas | 23 | 11 | 4-5 | 0-0 | 3-6 | 7 | 0 | 1 | 1 | 0 | 5 | 2 | 3 |
| Kota Suttle Jr. | 19 | 5 | 2-3 | 1-1 | 0-0 | 3 | 0 | 1 | 2 | 0 | 1 | 2 | 5 |
| Jackson Kiss | 18 | 4 | 2-4 | 0-1 | 0-0 | 3 | 2 | 4 | 1 | 1 | 0 | 3 | 3 |
| Moustapha Loum | 4 | 0 | 0-0 | 0-0 | 0-0 | 1 | 0 | 0 | 0 | 0 | 0 | 1 | 3 |
Exhibition team statistics
Exhibition games only. Regular-season totals are separate.
| Statistic | UNLV | Opponents |
|---|---|---|
| Games played | 3 | 3 |
| Exhibition record | 1-2 | 2-1 |
| Points | 236 | 249 |
| Field goals | 85-186 | 81-182 |
| Two-pointers | 64-124 | 52-97 |
| Three-pointers | 21-62 | 29-85 |
| Free throws | 45-76 | 58-77 |
| Rebounds | 130 | 102 |
| Offensive rebounds | 48 | 34 |
| Defensive rebounds | 82 | 68 |
| Assists | 42 | 51 |
| Steals | 25 | 28 |
| Blocks | 13 | 11 |
| Turnovers | 53 | 41 |
| Personal fouls | 59 | 63 |
| Fast-break points | 62 | 49 |
| Points in paint | 124 | 102 |
| Second-chance points | 42 | 37 |
| Points off turnovers | 50 | 63 |
| Bench points | 47 | 69 |
| Points per game | 78.7 | 83.0 |
| Rebounds per game | 43.3 | 34.0 |
| Turnovers per game | 17.7 | 13.7 |
UNLV vs. Utah · 2026-10-07
| Statistic | UNLV | Utah |
|---|---|---|
| Points | 69 | 79 |
| Field goals | 23-58 (39.7%) | 24-60 (40.0%) |
| Two-pointers | 15-30 (50.0%) | 14-28 (50.0%) |
| Three-pointers | 8-28 (28.6%) | 10-32 (31.3%) |
| Free throws | 15-29 (51.7%) | 21-25 (84.0%) |
| Rebounds | 45 | 37 |
| Offensive rebounds | 16 | 11 |
| Defensive rebounds | 29 | 26 |
| Assists | 13 | 15 |
| Steals | 7 | 12 |
| Blocks | 5 | 3 |
| Turnovers | 18 | 11 |
| Personal fouls | 19 | 23 |
| Fast-break points | 14 | 19 |
| Points in paint | 28 | 28 |
| Second-chance points | 9 | 15 |
| Points off turnovers | 11 | 18 |
| Bench points | 12 | 32 |
| Net rating | -13.9 | 13.9 |
| Offensive rating | 96.0 | 109.9 |
| Defensive rating | 109.9 | 96.0 |
| Pace | 71.9 | 71.9 |
| Effective FG% | 46.6% | 48.3% |
| Offensive rebound % | 38.1% | 27.5% |
| Turnover % | 20.3% | 13.4% |
| FT attempt rate | 50.0% | 41.7% |
| True shooting % | 48.8% | 55.6% |
| Assist % | 56.5% | 62.5% |
| Defensive rebound % | 72.5% | 61.9% |
| Steal % | 9.9% | 16.4% |
| Block % | 17.9% | 10.0% |
| Assist/turnover ratio | 0.72 | 1.36 |
UNLV vs. BYU · 2026-10-24
| Statistic | UNLV | BYU |
|---|---|---|
| Points | 77 | 89 |
| Field goals | 28-59 (47.5%) | 32-69 (46.4%) |
| Two-pointers | 22-41 (53.7%) | 22-39 (56.4%) |
| Three-pointers | 6-18 (33.3%) | 10-30 (33.3%) |
| Free throws | 15-21 (71.4%) | 15-21 (71.4%) |
| Rebounds | 41 | 34 |
| Offensive rebounds | 15 | 15 |
| Defensive rebounds | 26 | 19 |
| Assists | 12 | 19 |
| Steals | 5 | 9 |
| Blocks | 5 | 2 |
| Turnovers | 18 | 10 |
| Personal fouls | 16 | 17 |
| Fast-break points | 20 | 13 |
| Points in paint | 44 | 42 |
| Second-chance points | 13 | 17 |
| Points off turnovers | 14 | 19 |
| Bench points | 15 | 14 |
| Net rating | -16.7 | 16.7 |
| Offensive rating | 107.2 | 123.9 |
| Defensive rating | 123.9 | 107.2 |
| Pace | 71.8 | 71.8 |
| Effective FG% | 52.5% | 53.6% |
| Offensive rebound % | 44.1% | 36.6% |
| Turnover % | 20.9% | 11.3% |
| FT attempt rate | 35.6% | 30.4% |
| True shooting % | 56.4% | 56.9% |
| Assist % | 42.9% | 59.4% |
| Defensive rebound % | 63.4% | 55.9% |
| Steal % | 6.9% | 12.7% |
| Block % | 12.8% | 4.9% |
| Assist/turnover ratio | 0.67 | 1.90 |
UNLV vs. Missouri · 2026-10-29
| Statistic | UNLV | Missouri |
|---|---|---|
| Points | 90 | 81 |
| Field goals | 34-69 (49.3%) | 25-53 (47.2%) |
| Two-pointers | 27-53 (50.9%) | 16-30 (53.3%) |
| Three-pointers | 7-16 (43.8%) | 9-23 (39.1%) |
| Free throws | 15-26 (57.7%) | 22-31 (71.0%) |
| Rebounds | 44 | 31 |
| Offensive rebounds | 17 | 8 |
| Defensive rebounds | 27 | 23 |
| Assists | 17 | 17 |
| Steals | 13 | 7 |
| Blocks | 3 | 6 |
| Turnovers | 17 | 20 |
| Personal fouls | 24 | 23 |
| Fast-break points | 28 | 17 |
| Points in paint | 52 | 32 |
| Second-chance points | 20 | 5 |
| Points off turnovers | 25 | 26 |
| Bench points | 20 | 23 |
| Net rating | 11.3 | -11.3 |
| Offensive rating | 113.2 | 101.9 |
| Defensive rating | 101.9 | 113.2 |
| Pace | 79.5 | 79.5 |
| Effective FG% | 54.3% | 55.7% |
| Offensive rebound % | 42.5% | 22.9% |
| Turnover % | 17.4% | 23.1% |
| FT attempt rate | 37.7% | 58.5% |
| True shooting % | 55.9% | 60.8% |
| Assist % | 50.0% | 68.0% |
| Defensive rebound % | 77.1% | 57.5% |
| Steal % | 16.6% | 8.7% |
| Block % | 10.0% | 11.3% |
| Assist/turnover ratio | 1.00 | 0.85 |
CBB Analytics